
Saturation-Transfer-Difference (STD) experiment is a popular NMR technique to study ligand binding to proteins. Below please find information on this pulse sequence within VNMRJ Biopack.
1, Where to find STD sequences
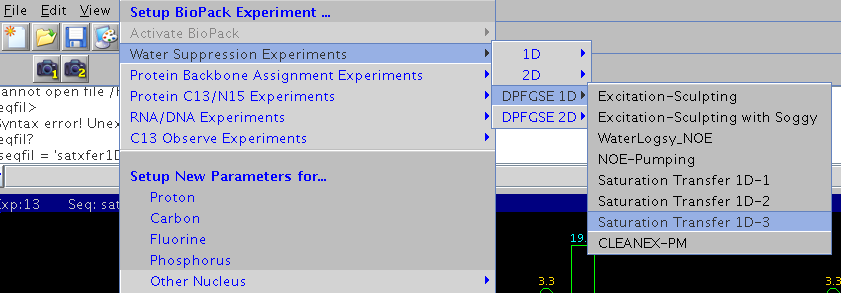
In VnmrJ Biopack: Experiments -> Water Suppression Experiments-> DPFGSE 1D,
there are Saturation Transfer 1D-1, 1D-2, and, 1D-3.
- 1D-1 STD without DPFGSE sculpted solvent suppression.
- 1D-2 STD with DPFGSE, saves only the difference spectrum between on- and off-resonance data. The subtraction is done internally by phase cycling.
- 1D-3 STD with DPFGSE, saves on- and off-resonance spectra separately.
It is preferred to use this last sequence to acquire STD and do manual subtraction later.
2, Setup
- First like setting up any NMR experiment, please make sure the probe is tuned, lock, and shimmings are good. Also the 90 degree 1H hard pulse width needs be accurately measured.
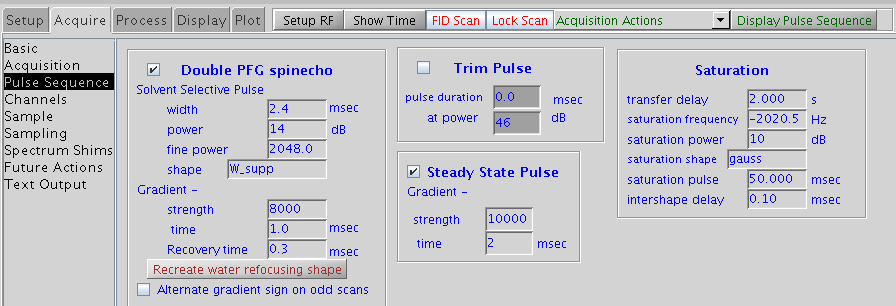
- Pay attention to the first 3 parameters in the Saturation section in the pulse sequence interface.
- xferdly transfer delay, default 2 s, can be arrayed, eg xferdly=1,2,3,4 to run 4 sets with saturation times 1-4s
- satpwr saturation power default 10 dB
- satfrq saturation frequency in Hz. array between two frequecies: one set on proton signals of the protein (on resonance); one set outside the signal region for reference eg. at 30ppm (off resonance). Note satfrq should not be close to ligand signal frequency.
- If 1H 90 degree pulse is different from default value, click ‘Recreate water refocusing shape’ under Double PFG spinecho section.
- Default settings can be used for other parameters. For more information on the sequence, take a look at the source code /vnmr/biopack/psglib/dpfgse_satxfer2.c
- To study Kd using STD, ligand titration needs be done wisely. First several points below 1mM are critical to get a good fitting, so trying to add more points at low ligand concentrations, 0-1mM, in the beginning. Saturation time also needs be arrayed at each ligand concentration. (see ref)
- Finally, it is recommended to collect a regular 1D 1H spectrum at each titration point to be used as a reference spectrum and also be used to estimate the ligand concentration. Pipette could add a little more or less volume to your sample, but the spectral integrals will let you know the concentration more accurately .
3, Processing
Any NMR processing software can be used. Below is how STD is processed using VnmrJ.
- Process the data like a regular 1D 1H NMR. Integrate signals of interest on the first spectrum. set insref=0, or as long as insref not equal to ‘n’, type dli, and copy down the absolute integral values.
- svp(‘std.par’). This saves the processing parameters including lifrq, the frequencies of integral reset points created on the first spectrum
- If data is arrayed, ds(1), ds(2), etc will read in the individual spectrum, then use dli to get the integral values.
- Read in second STD data, rtp(‘std.par’) retrieves saved processing parameters. Phasing may need adjust slightly. dli, gives absolute integrals for the second STD data.
- Note, all STD data need be processed identically for quantitative analysis. To save a parameter set is for this purpose. Others such as baseline correction also needs be done identically for all STD data in order to obtain more comparable integral values.
- If manual subtraction is needed, use the add/subtract experiment within VnmrJ. eg. to subtract an arrayed data consisting of two sub-spectra. First read in the data file in a buffer that is not exp5,
-
- clradd —> clear add/subtract experiment, which is exp5.
- df(1) —> read in the first FID in the arrayed data
- add —> add current FID to add/subtract experiment, i.e. exp5
- df(2) —> read in the second FID in the arrayed data
- sub —> Subtract current FID from exp5, the result is again saved in exp5
- jexp5 —> jump to exp5 and save the difference FID for later process
-
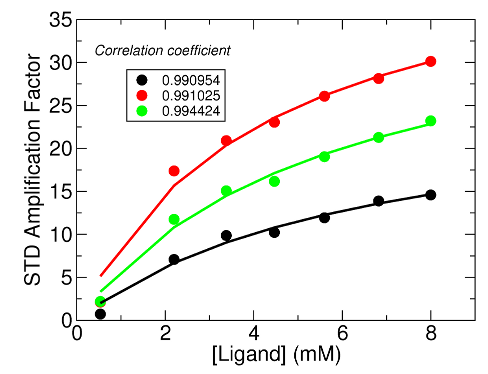
The figure below shows a preliminary STD result. The STD amplification factor:
STD-AF = [L] / [P] * (Iref – Isat) / Iref
[L] and [P] are the ligand and protein concentrations, respectively, [L] is much greater than [P]. Isat, and Iref are the integrals of peak of interest from on-resonance and off-resonance spectrum, respectively. Please refer to the reference paper for more detail.
References
(1) Ligand-receptor binding affinities from saturation transfer difference (STD) NMR spectroscopy: the binding isotherm of STD initial growth rates.
Angulo J, Enríquez-Navas PM, Nieto PM.
Chemistry. 2010 Jul 12;16(26):7803-12. PubMed
(2) VnmrJ Command and Parameter Reference Pub. No. 01-999370-00, Rev. A 0208
Acknowledgment
We thank Dr. Samson Francis and Prof. Erin Carlson for kindly sharing their preliminary data.
